Setting up Prometheus and Grafana to monitor Longhorn
Overview
Longhorn natively exposes metrics in Prometheus text format on a REST endpoint http://LONGHORN_MANAGER_IP:PORT/metrics.
See Longhorn's metrics for the descriptions of all available metrics.
You can use any collecting tools such as Prometheus, Graphite, Telegraf to scrape these metrics then visualize the collected data by tools such as Grafana.
This document presents an example setup to monitor Longhorn. The monitoring system uses Prometheus for collecting data and alerting, Grafana for visualizing/dashboarding the collected data. From a high-level overview, the monitoring system contains:
- Prometheus server which scrapes and stores time series data from Longhorn metrics endpoints. The Prometheus is also responsible for generating alerts base on configured rules and collected data. Prometheus servers then send alerts to an Alertmanager.
- AlertManager then manages those alerts, including silencing, inhibition, aggregation, and sending out notifications via methods such as email, on-call notification systems, and chat platforms.
- Grafana which queries Prometheus server for data and draws a dashboard for visualization.
The below picture describes the detailed architecture of the monitoring system.
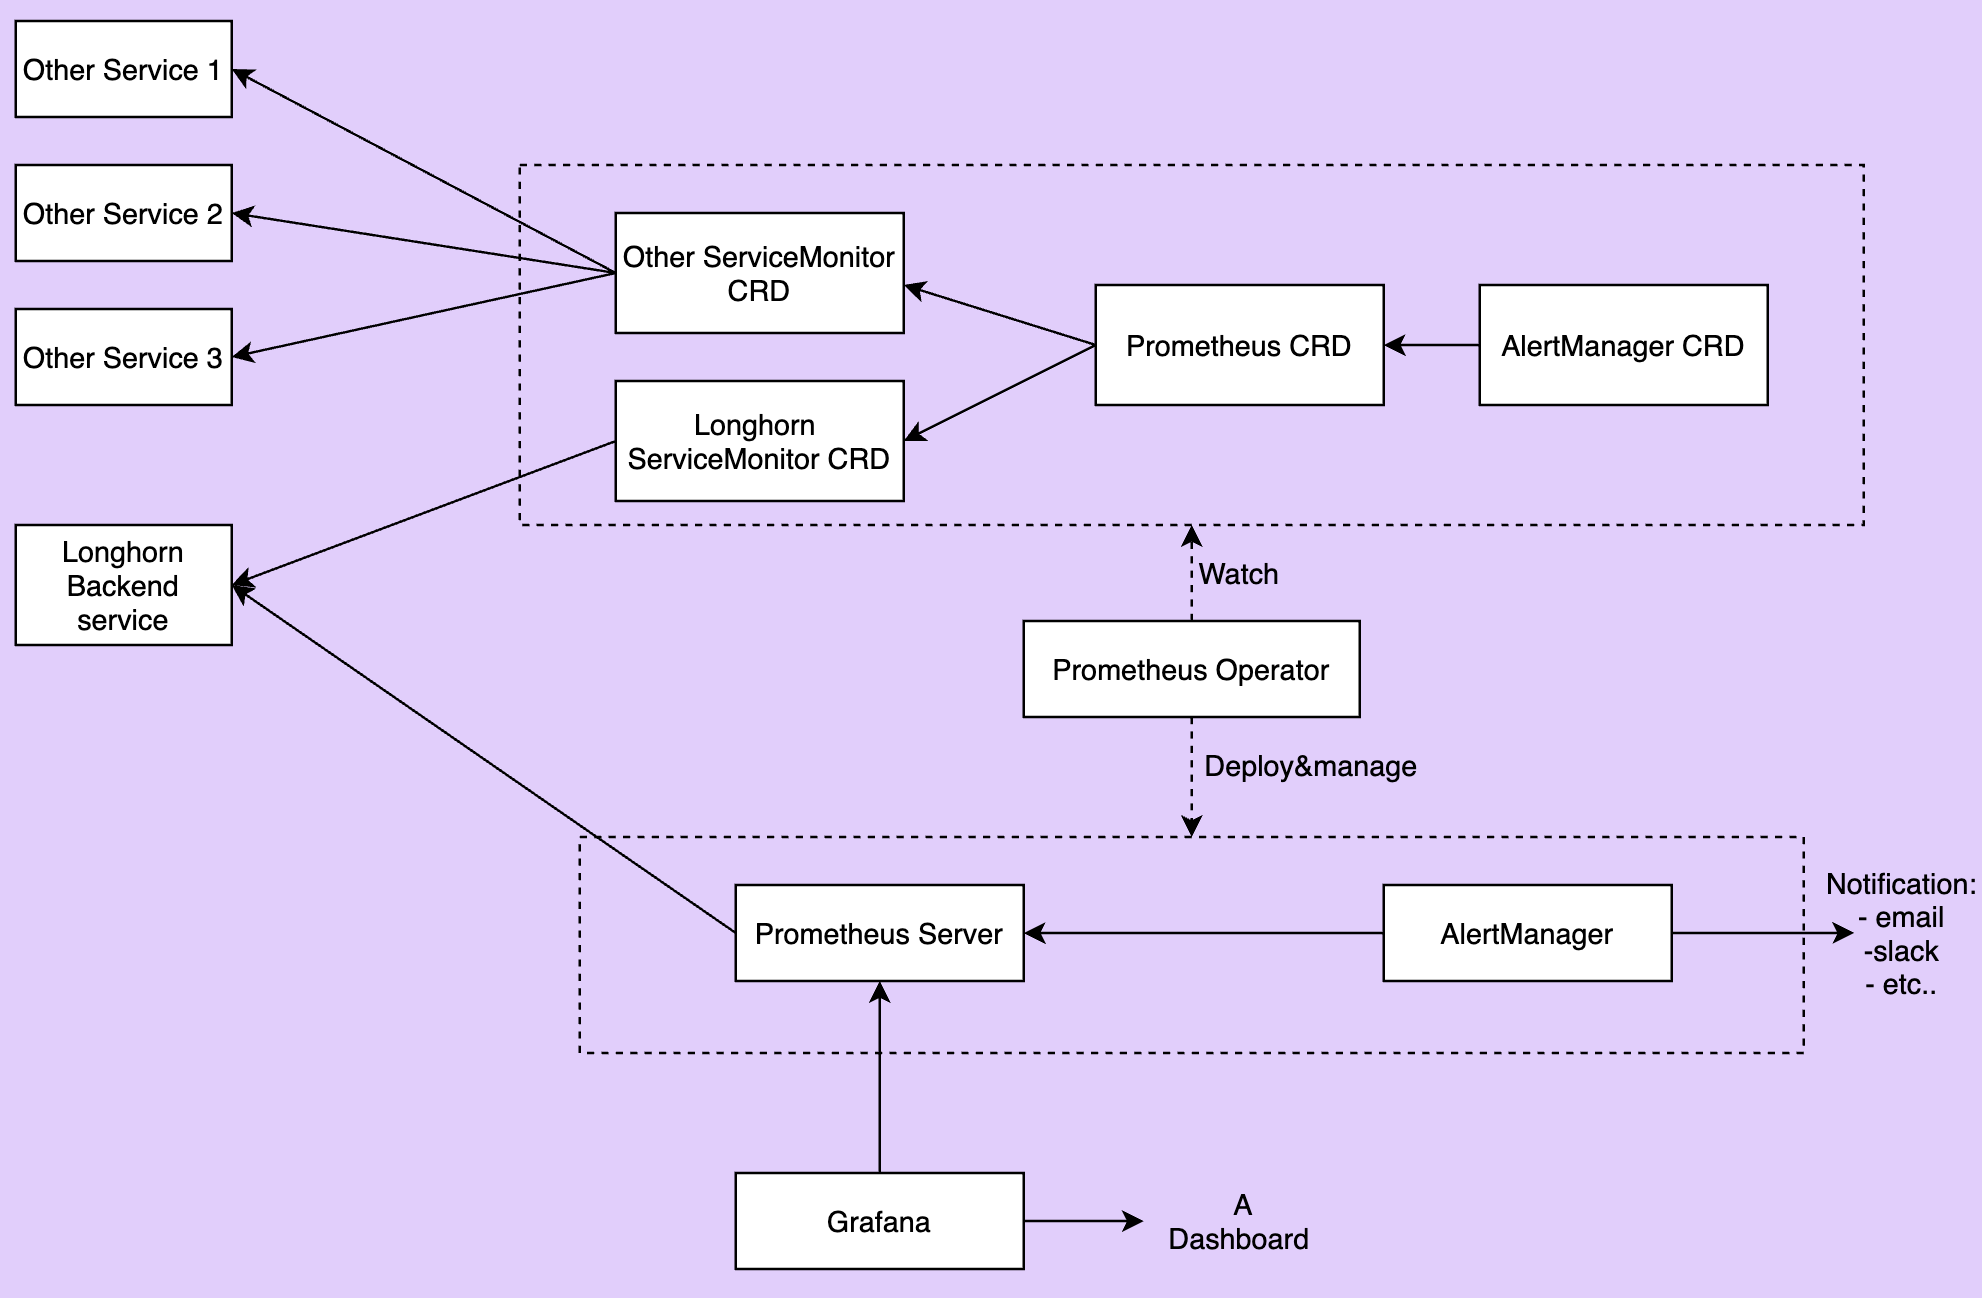
There are 2 unmentioned components in the above picture:
- Longhorn Backend service is a service pointing to the set of Longhorn manager pods. Longhorn's metrics are exposed in Longhorn manager pods at the endpoint
http://LONGHORN_MANAGER_IP:PORT/metrics. - Prometheus operator makes running Prometheus on top of Kubernetes very easy. The operator watches 3 custom resources: ServiceMonitor, Prometheus and AlertManager. When users create those custom resources, Prometheus Operator deploys and manages the Prometheus server, AlerManager with the user-specified configurations.
Installation
Following this instruction will install all components into the monitoring namespace. To install them into a different namespace, change the field namespace: OTHER_NAMESPACE
Create monitoring namespace
apiVersion: v1
kind: Namespace
metadata:
  name: monitoring
Install Prometheus Operator
Deploy Prometheus Operator and its required ClusterRole, ClusterRoleBinding, and Service Account.
apiVersion: rbac.authorization.k8s.io/v1
kind: ClusterRoleBinding
metadata:
  labels:
    app.kubernetes.io/component: controller
    app.kubernetes.io/name: prometheus-operator
    app.kubernetes.io/version: v0.38.3
  name: prometheus-operator
  namespace: monitoring
roleRef:
  apiGroup: rbac.authorization.k8s.io
  kind: ClusterRole
  name: prometheus-operator
subjects:
- kind: ServiceAccount
  name: prometheus-operator
  namespace: monitoring
---
apiVersion: rbac.authorization.k8s.io/v1
kind: ClusterRole
metadata:
  labels:
    app.kubernetes.io/component: controller
    app.kubernetes.io/name: prometheus-operator
    app.kubernetes.io/version: v0.38.3
  name: prometheus-operator
  namespace: monitoring
rules:
- apiGroups:
  - apiextensions.k8s.io
  resources:
  - customresourcedefinitions
  verbs:
  - create
- apiGroups:
  - apiextensions.k8s.io
  resourceNames:
  - alertmanagers.monitoring.coreos.com
  - podmonitors.monitoring.coreos.com
  - prometheuses.monitoring.coreos.com
  - prometheusrules.monitoring.coreos.com
  - servicemonitors.monitoring.coreos.com
  - thanosrulers.monitoring.coreos.com
  resources:
  - customresourcedefinitions
  verbs:
  - get
  - update
- apiGroups:
  - monitoring.coreos.com
  resources:
  - alertmanagers
  - alertmanagers/finalizers
  - prometheuses
  - prometheuses/finalizers
  - thanosrulers
  - thanosrulers/finalizers
  - servicemonitors
  - podmonitors
  - prometheusrules
  verbs:
  - '*'
- apiGroups:
  - apps
  resources:
  - statefulsets
  verbs:
  - '*'
- apiGroups:
  - ""
  resources:
  - configmaps
  - secrets
  verbs:
  - '*'
- apiGroups:
  - ""
  resources:
  - pods
  verbs:
  - list
  - delete
- apiGroups:
  - ""
  resources:
  - services
  - services/finalizers
  - endpoints
  verbs:
  - get
  - create
  - update
  - delete
- apiGroups:
  - ""
  resources:
  - nodes
  verbs:
  - list
  - watch
- apiGroups:
  - ""
  resources:
  - namespaces
  verbs:
  - get
  - list
  - watch
---
apiVersion: apps/v1
kind: Deployment
metadata:
  labels:
    app.kubernetes.io/component: controller
    app.kubernetes.io/name: prometheus-operator
    app.kubernetes.io/version: v0.38.3
  name: prometheus-operator
  namespace: monitoring
spec:
  replicas: 1
  selector:
    matchLabels:
      app.kubernetes.io/component: controller
      app.kubernetes.io/name: prometheus-operator
  template:
    metadata:
      labels:
        app.kubernetes.io/component: controller
        app.kubernetes.io/name: prometheus-operator
        app.kubernetes.io/version: v0.38.3
    spec:
      containers:
      - args:
        - --kubelet-service=kube-system/kubelet
        - --logtostderr=true
        - --config-reloader-image=jimmidyson/configmap-reload:v0.3.0
        - --prometheus-config-reloader=quay.io/prometheus-operator/prometheus-config-reloader:v0.38.3
        image: quay.io/prometheus-operator/prometheus-operator:v0.38.3
        name: prometheus-operator
        ports:
        - containerPort: 8080
          name: http
        resources:
          limits:
            cpu: 200m
            memory: 200Mi
          requests:
            cpu: 100m
            memory: 100Mi
        securityContext:
          allowPrivilegeEscalation: false
      nodeSelector:
        beta.kubernetes.io/os: linux
      securityContext:
        runAsNonRoot: true
        runAsUser: 65534
      serviceAccountName: prometheus-operator
---
apiVersion: v1
kind: ServiceAccount
metadata:
  labels:
    app.kubernetes.io/component: controller
    app.kubernetes.io/name: prometheus-operator
    app.kubernetes.io/version: v0.38.3
  name: prometheus-operator
  namespace: monitoring
---
apiVersion: v1
kind: Service
metadata:
  labels:
    app.kubernetes.io/component: controller
    app.kubernetes.io/name: prometheus-operator
    app.kubernetes.io/version: v0.38.3
  name: prometheus-operator
  namespace: monitoring
spec:
  clusterIP: None
  ports:
  - name: http
    port: 8080
    targetPort: http
  selector:
    app.kubernetes.io/component: controller
    app.kubernetes.io/name: prometheus-operator
Install Longhorn ServiceMonitor
Longhorn ServiceMonitor has a label selector app: longhorn-manager to select Longhorn backend service.
Later on, the Prometheus CRD can include Longhorn ServiceMonitor so that the Prometheus server can discover all Longhorn manager pods and their endpoints.
apiVersion: monitoring.coreos.com/v1
kind: ServiceMonitor
metadata:
  name: longhorn-prometheus-servicemonitor
  namespace: monitoring
  labels:
    name: longhorn-prometheus-servicemonitor
spec:
  selector:
    matchLabels:
      app: longhorn-manager
  namespaceSelector:
    matchNames:
    - longhorn-system
  endpoints:
  - port: manager
Install and configure Prometheus AlertManager
-
Create a highly available Alertmanager deployment with 3 instances:
apiVersion: monitoring.coreos.com/v1
kind: Alertmanager
metadata:
  name: longhorn
  namespace: monitoring
spec:
replicas: 3 -
The Alertmanager instances will not be able to start up unless a valid configuration is given. See here for more explanation about Alertmanager configuration. The following code gives an example configuration:
global:
  resolve_timeout: 5m
route:
  group_by: [alertname]
  receiver: email_and_slack
receivers:
- name: email_and_slack
  email_configs:
  - to: <the email address to send notifications to>
    from: <the sender address>
    smarthost: <the SMTP host through which emails are sent>
    # SMTP authentication information.
    auth_username: <the username>
    auth_identity: <the identity>
    auth_password: <the password>
    headers:
      subject: 'Longhorn-Alert'
    text: |-
      {{ range .Alerts }}
        *Alert:* {{ .Annotations.summary }} - `{{ .Labels.severity }}`
        *Description:* {{ .Annotations.description }}
        *Details:*
        {{ range .Labels.SortedPairs }} • *{{ .Name }}:* `{{ .Value }}`
        {{ end }}
      {{ end }}
  slack_configs:
  - api_url: <the Slack webhook URL>
    channel: <the channel or user to send notifications to>
    text: |-
      {{ range .Alerts }}
        *Alert:* {{ .Annotations.summary }} - `{{ .Labels.severity }}`
        *Description:* {{ .Annotations.description }}
        *Details:*
        {{ range .Labels.SortedPairs }} • *{{ .Name }}:* `{{ .Value }}`
        {{ end }}
      {{ end }}
Save the above Alertmanager config in a file called
alertmanager.yamland create a secret from it using kubectl.Alertmanager instances require the secret resource naming to follow the format
alertmanager-{ALERTMANAGER_NAME}. In the previous step, the name of the Alertmanager islonghorn, so the secret name must bealertmanager-longhorn$ kubectl create secret generic alertmanager-longhorn --from-file=alertmanager.yaml -n monitoring -
To be able to view the web UI of the Alertmanager, expose it through a Service. A simple way to do this is to use a Service of type NodePort:
apiVersion: v1
kind: Service
metadata:
  name: alertmanager-longhorn
  namespace: monitoring
spec:
  type: NodePort
  ports:
  - name: web
    nodePort: 30903
    port: 9093
    protocol: TCP
    targetPort: web
  selector:
    alertmanager: longhorn
After creating the above service, you can access the web UI of Alertmanager via a Node's IP and the port 30903.
Use the above
NodePortservice for quick verification only because it doesn't communicate over the TLS connection. You may want to change the service type toClusterIP, and set up an Ingress-controller to expose the web UI of Alertmanager over TLS connection.
Install and configure Prometheus server
-
Create PrometheusRule custom resource which defines alert conditions. See more examples about Longhorn alert rules at Longhorn Alert Rule Examples.
apiVersion: monitoring.coreos.com/v1
kind: PrometheusRule
metadata:
  labels:
    prometheus: longhorn
    role: alert-rules
  name: prometheus-longhorn-rules
  namespace: monitoring
spec:
  groups:
  - name: longhorn.rules
    rules:
    - alert: LonghornVolumeUsageCritical
      annotations:
        description: Longhorn volume {{$labels.volume}} on {{$labels.node}} is at {{$value}}% used for
          more than 5 minutes.
        summary: Longhorn volume capacity is over 90% used.
      expr: 100 * (longhorn_volume_usage_bytes / longhorn_volume_capacity_bytes) > 90
      for: 5m
      labels:
        issue: Longhorn volume {{$labels.volume}} usage on {{$labels.node}} is critical.
        severity: critical
For more information on how to define alert rules see here.
-
If RBAC authorization is activated, Create a ClusterRole and ClusterRoleBinding for the Prometheus Pods:
apiVersion: v1
kind: ServiceAccount
metadata:
  name: prometheus
namespace: monitoringapiVersion: rbac.authorization.k8s.io/v1beta1
kind: ClusterRole
metadata:
name: prometheus
namespace: monitoring
rules:
- apiGroups: [""]
resources:
- nodes
- services
- endpoints
- pods
verbs: ["get", "list", "watch"]
- apiGroups: [""]
resources:
- configmaps
verbs: ["get"]
- nonResourceURLs: ["/metrics"]
verbs: ["get"]apiVersion: rbac.authorization.k8s.io/v1beta1
kind: ClusterRoleBinding
metadata:
name: prometheus
roleRef:
apiGroup: rbac.authorization.k8s.io
kind: ClusterRole
name: prometheus
subjects:
- kind: ServiceAccount
name: prometheus
namespace: monitoring -
Create a Prometheus custom resource. Notice that we select the Longhorn service monitor and Longhorn rules in the spec.
apiVersion: monitoring.coreos.com/v1
kind: Prometheus
metadata:
  name: prometheus
  namespace: monitoring
spec:
  replicas: 2
  serviceAccountName: prometheus
  alerting:
    alertmanagers:
      - namespace: monitoring
        name: alertmanager-longhorn
        port: web
  serviceMonitorSelector:
    matchLabels:
      name: longhorn-prometheus-servicemonitor
  ruleSelector:
    matchLabels:
      prometheus: longhorn
role: alert-rules -
To be able to view the web UI of the Prometheus server, expose it through a Service. A simple way to do this is to use a Service of type NodePort:
apiVersion: v1
kind: Service
metadata:
  name: prometheus
  namespace: monitoring
spec:
  type: NodePort
  ports:
  - name: web
    nodePort: 30904
    port: 9090
    protocol: TCP
    targetPort: web
  selector:
    prometheus: prometheus
After creating the above service, you can access the web UI of Prometheus server via a Node's IP and the port 30904.
At this point, you should be able to see all Longhorn manager targets as well as Longhorn rules in the targets and rules section of the Prometheus server UI.
Use the above NodePort service for quick verification only because it doesn't communicate over TLS connection. You may want to change the service type to
ClusterIP, and set up an Ingress-controller to expose the web UI of Prometheus server over TLS connection.
Install Grafana
-
Create Grafana datasource config:
apiVersion: v1
kind: ConfigMap
metadata:
  name: grafana-datasources
  namespace: monitoring
data:
  prometheus.yaml: |-
    {
        "apiVersion": 1,
        "datasources": [
            {
               "access":"proxy",
                "editable": true,
                "name": "prometheus",
                "orgId": 1,
                "type": "prometheus",
                "url": "http://prometheus:9090",
                "version": 1
            }
        ]
} -
Create Grafana deployment:
apiVersion: apps/v1
kind: Deployment
metadata:
  name: grafana
  namespace: monitoring
  labels:
    app: grafana
spec:
  replicas: 1
  selector:
    matchLabels:
      app: grafana
  template:
    metadata:
      name: grafana
      labels:
        app: grafana
    spec:
      containers:
      - name: grafana
        image: grafana/grafana:7.1.5
        ports:
        - name: grafana
          containerPort: 3000
        resources:
          limits:
            memory: "500Mi"
            cpu: "300m"
          requests:
            memory: "500Mi"
            cpu: "200m"
        volumeMounts:
          - mountPath: /var/lib/grafana
            name: grafana-storage
          - mountPath: /etc/grafana/provisioning/datasources
            name: grafana-datasources
            readOnly: false
      volumes:
        - name: grafana-storage
          emptyDir: {}
        - name: grafana-datasources
          configMap:
              defaultMode: 420
name: grafana-datasources -
Expose Grafana on NodePort 32000:
apiVersion: v1
kind: Service
metadata:
  name: grafana
  namespace: monitoring
spec:
  selector:
    app: grafana
  type: NodePort
  ports:
    - port: 3000
      targetPort: 3000
      nodePort: 32000
Use the above NodePort service for quick verification only because it doesn't communicate over TLS connection. You may want to change the service type to ClusterIP, and setup an Ingress-controller to expose Grafana over TLS connection.
-
Access the Grafana dashboard using any node IP on port 32000. The default credential is:
User: admin
Pass: admin -
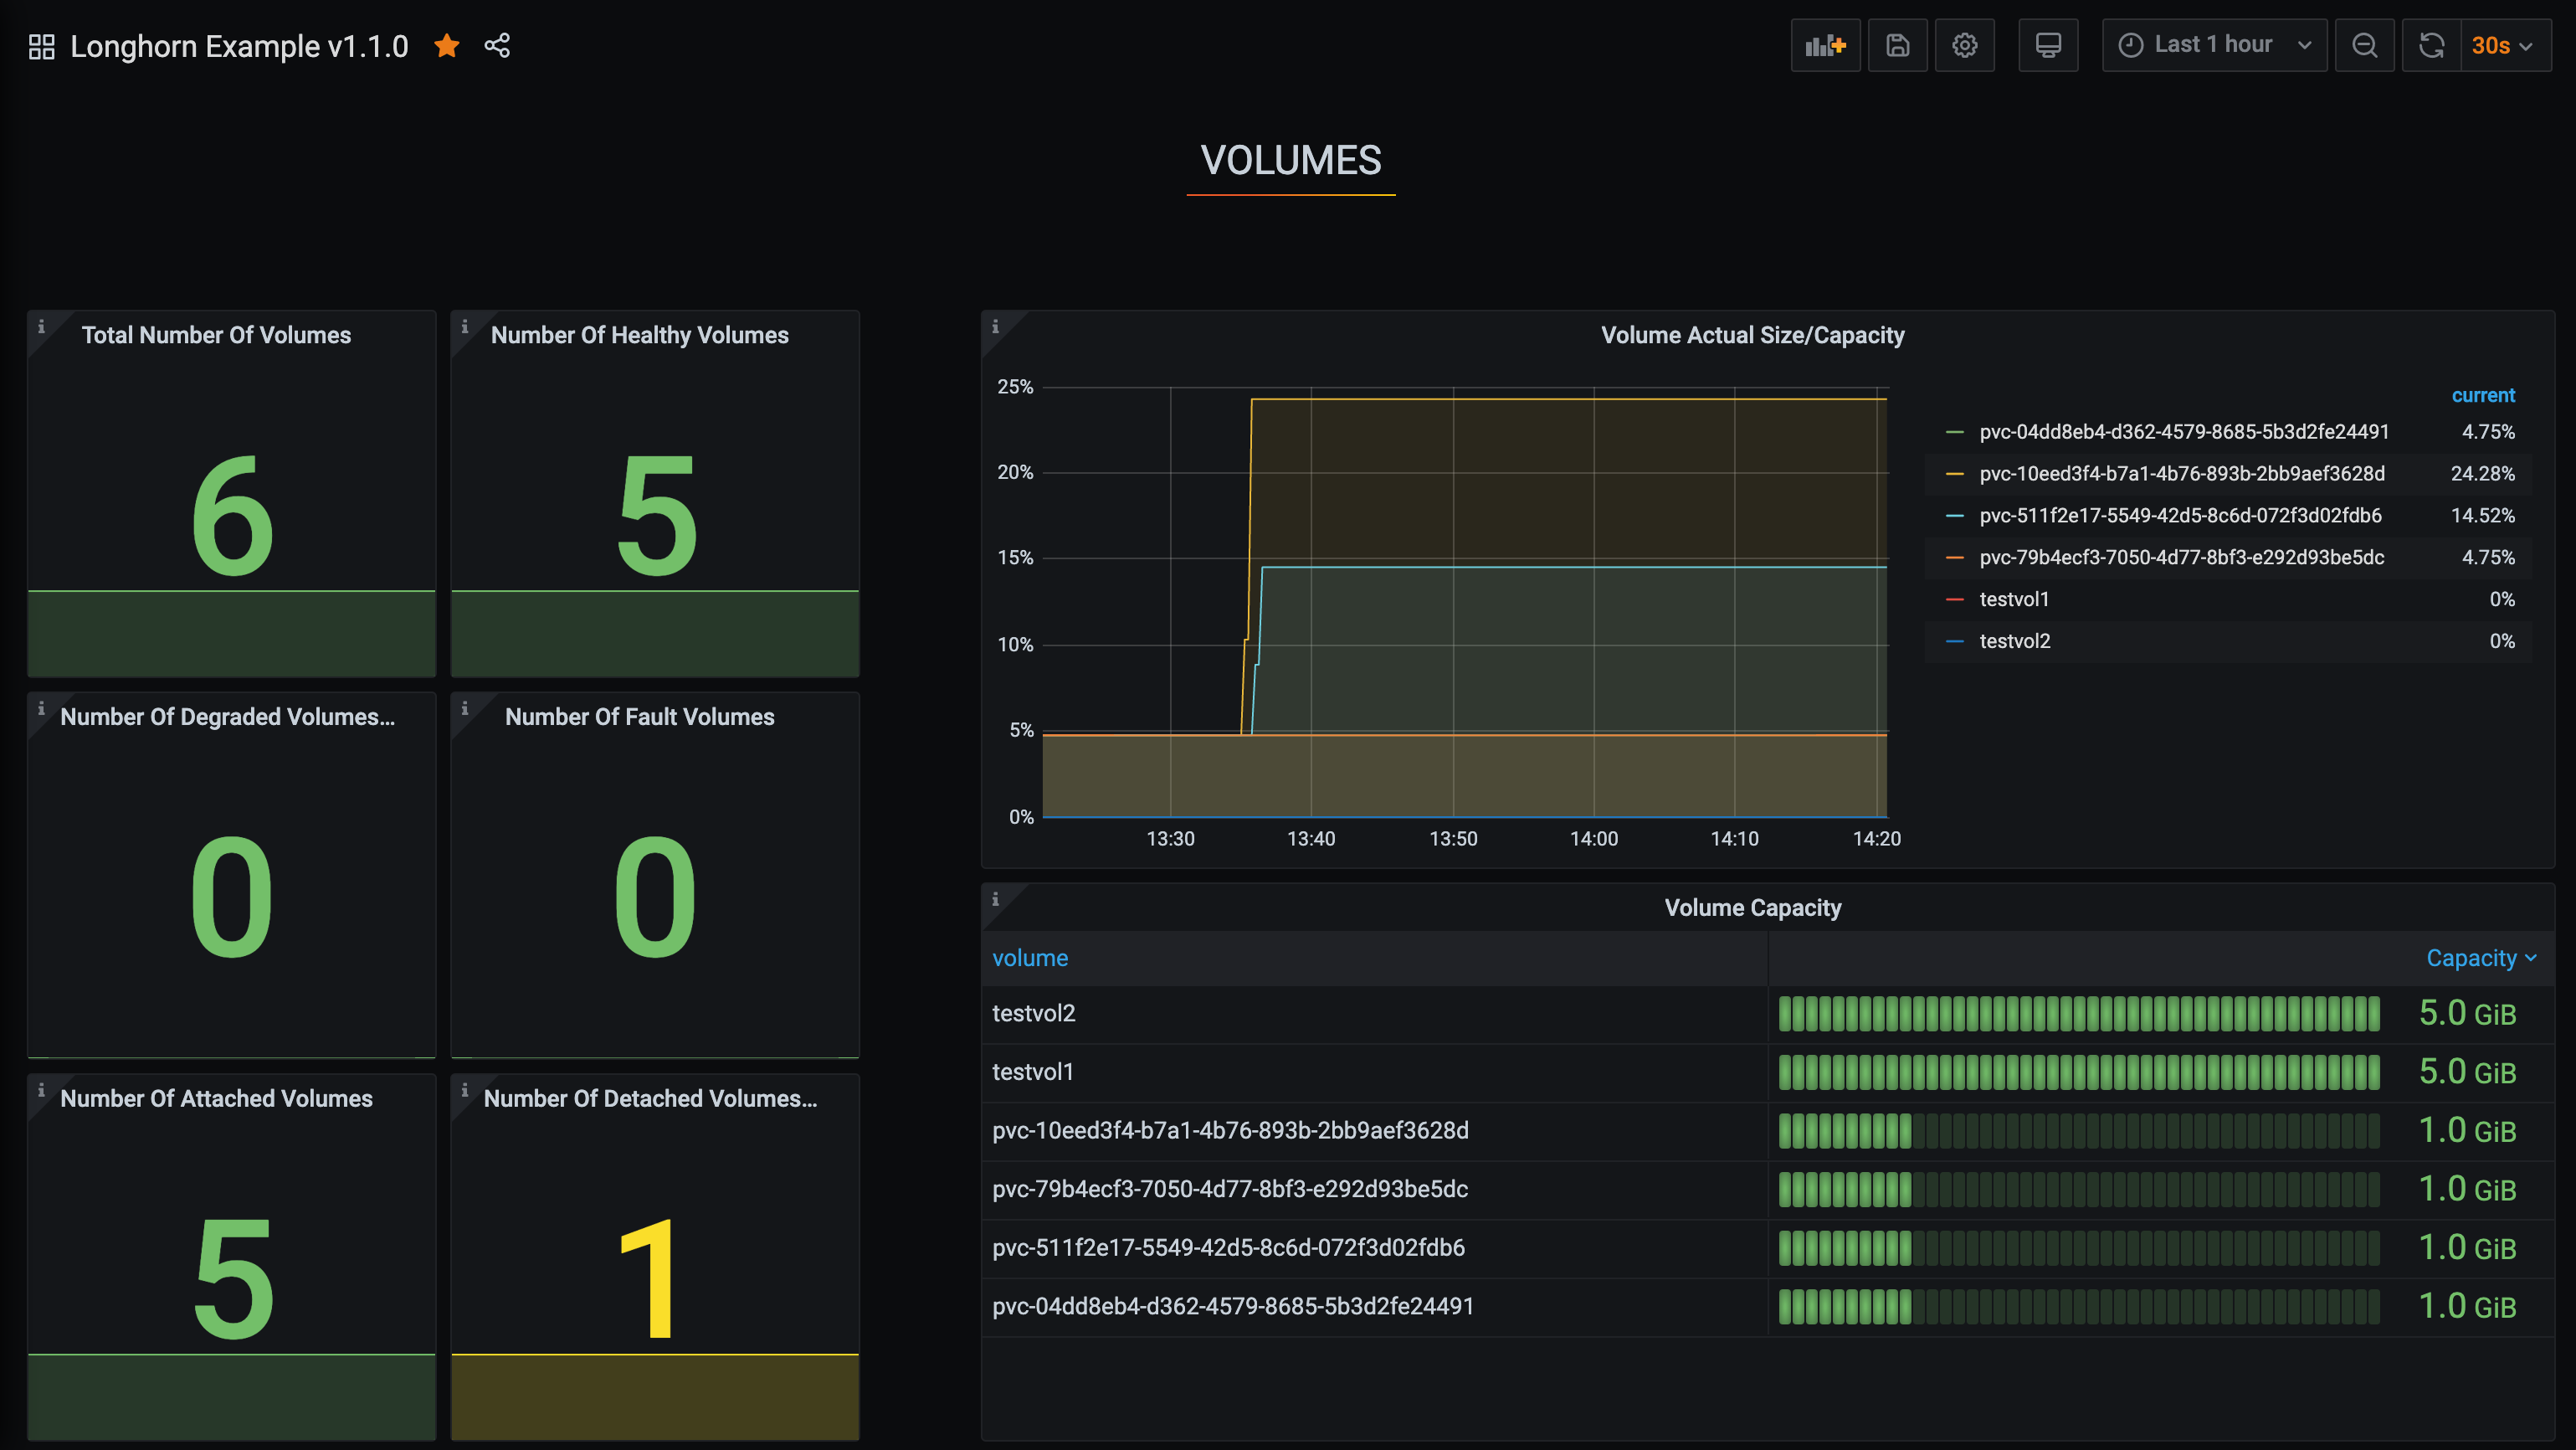
Setup Longhorn dashboard
Once inside Grafana, import the prebuilt Longhorn example dashboard.
See https://grafana.com/docs/grafana/latest/reference/export_import/ for the instructions about how to import a Grafana dashboard.
You should see the following dashboard upon successful: